
Graphical Scheduler shows Microsoft Dynamics 365 Business Central work center load, machine downtime, closed hours and late production orders on one schedule. This is a completely free app from Insight Works for Business Central.
Business Central holds all four. They just live on different pages: routing lines on each production order, work center load in its own list, shop calendars in setup, and machine downtime in capacity absences. Checking them one at a time is slow, and it is easy to miss the conflict between them.
Graphical Scheduler is a Business Central scheduling app, published as an extension on Microsoft Marketplace, that puts them on one board. In a recorded walkthrough, Mark Hamblin, Senior Solution Advisor at Insight Works, starts from the default install and builds a planner’s view step by step. This article follows his steps.
Watch the walkthrough: Business Central production scheduling in minutes, not hours (15 minutes, with chapters and a full transcript).
What does Graphical Scheduler show out of the box?
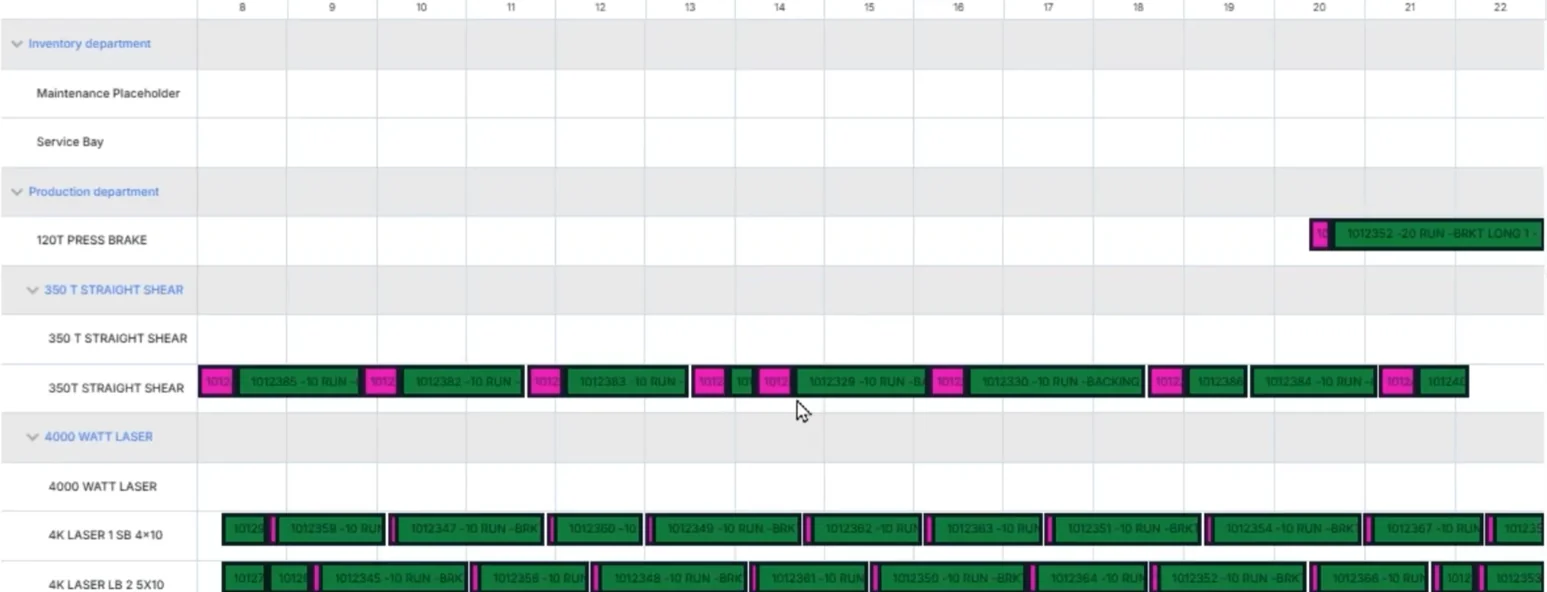
Right after install, Graphical Scheduler shows work center groups across the top, work centers and machine centers down the side, and production order operations on a timeline in between. Search for Graphical Scheduler in Business Central to open it, or launch it from the Role Centers it is added to.
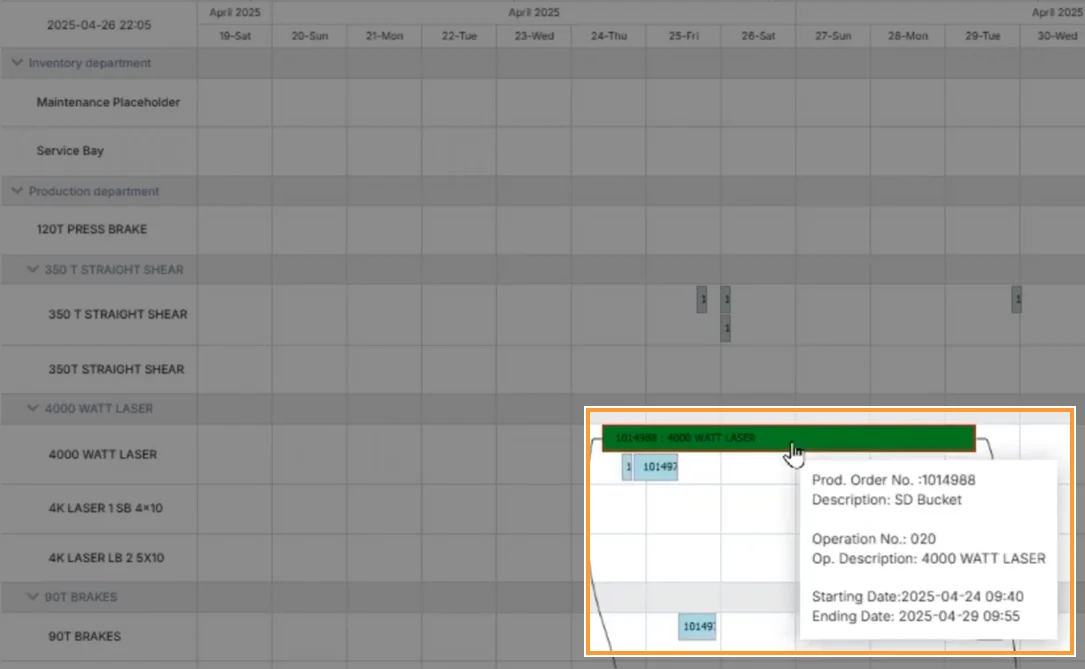
Hover over an operation to see its details in a tooltip. Click it, and every related operation on the same production order is highlighted. The tooltip text, the text in each block, the colors and even the block height are all configurable.
How do you make your own view without changing everyone else’s?
Everything on the board is controlled by a view. Editing the default view changes it for every user. To make changes for yourself only, use Copy to and create a new view from the default. Copy to can also replace an existing view or merge your changes into a different one.
Each view sets which production orders appear. The default filter covers planned, firm planned and released orders. A view can also block drag and drop entirely, which suits people who should look but not reschedule.
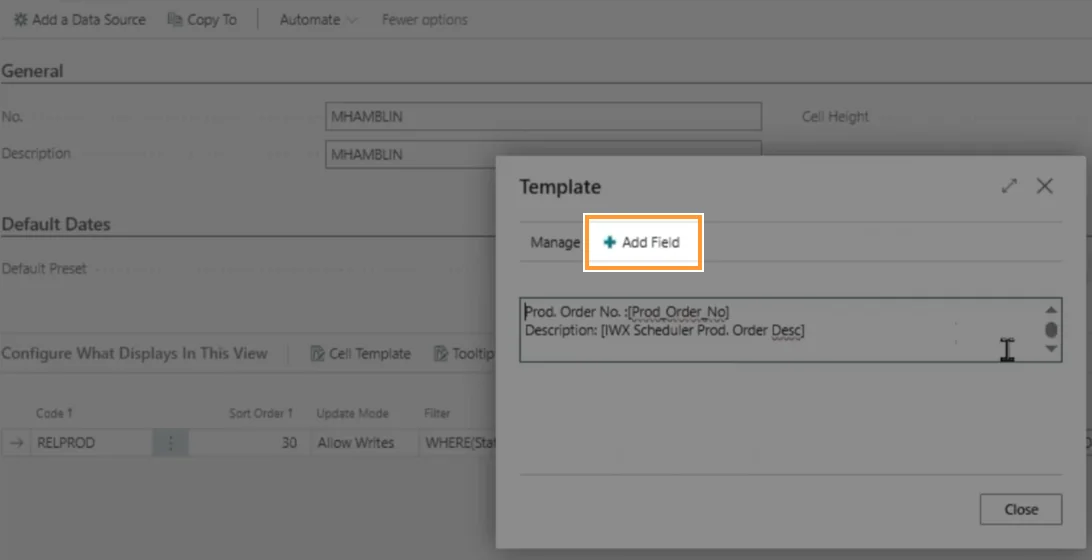
The tooltip and cell templates sit in the same place. To add a field to the tooltip, pick it from the list and drop it into the template. See customizable schedule views for the full set of options.
How do you color code production orders by status?
Color rules are set in the view. Each rule has a style name, a condition and the colors to apply: background, border and text.
In the walkthrough, Mark creates a rule named Planned. When the production order status is planned, the block turns teal with a black border and black text. Every planned order now shows in teal, so it is easy to tell what is still only planned.
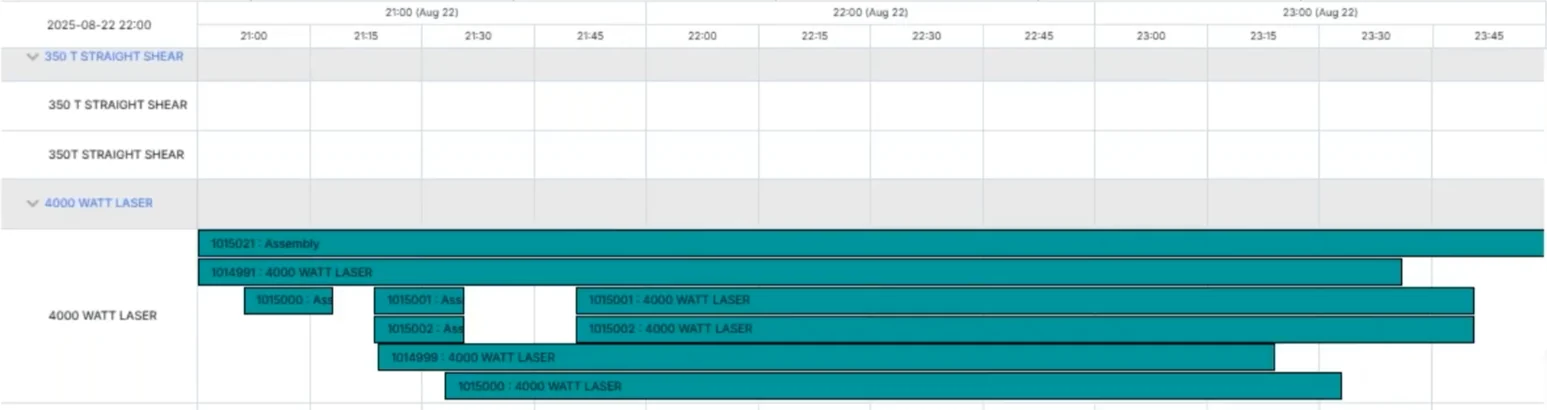
The same approach works for any field, including whether an operation is late. More examples are on the production schedule color coding page.
How do you see Business Central work center load?
Add work center loading as a data source. In the view, select Add data source, then choose the standard work center load source. Set its sort order so it sits at the top of the chart.
The load source comes with color rules already in place. For example, a work center loaded above 95% changes color. You can keep those defaults or set your own.
Once added, each work center shows its load for the period on screen. An overloaded work center turns red, so the problem is visible before the shop floor finds it.
In the walkthrough, the laser work center shows a load of 106.9%. Hovering over it shows 16 hours of effective capacity and -1.1 hours available, so more work is booked than the laser can run.
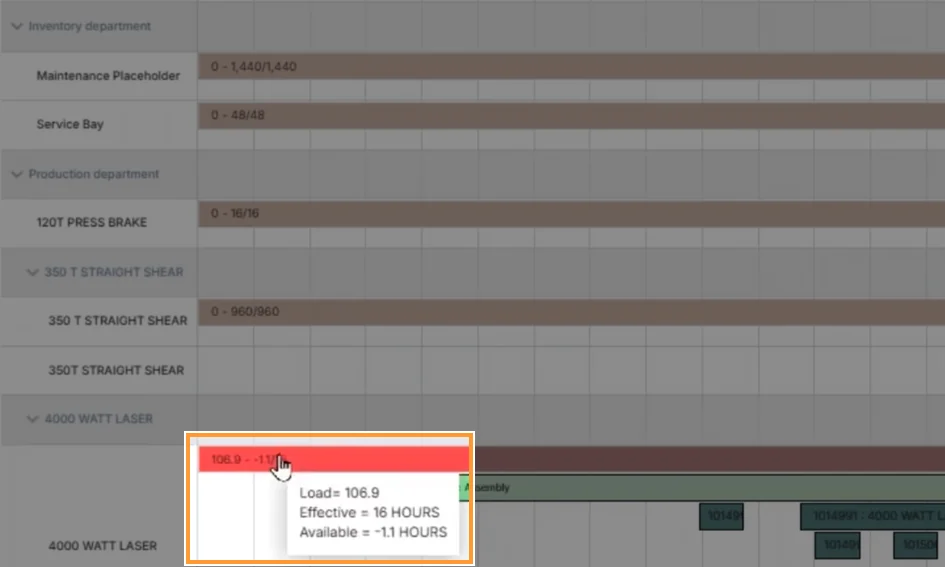
A view does not have to show production orders at all. A view with only the load source becomes a capacity chart across every work center, where the planner scans for red. See work center loading for details.
How do you show or hide non-working hours?
Add the normal working hours data source to the view. It offers two choices for the time the shop is closed:
- Color non-working hours, so evenings and weekends stay on the chart in a different shade.
- Hide non-working hours, so a shop that runs 8:00 a.m. to 5:00 p.m. sees only those hours, day after day.
This matters when you drag an operation. In the walkthrough, one moved operation stretches out because it now runs over the weekend. Business Central schedules work around closed hours. Shading those hours makes the reason obvious. See work center calendar integration.
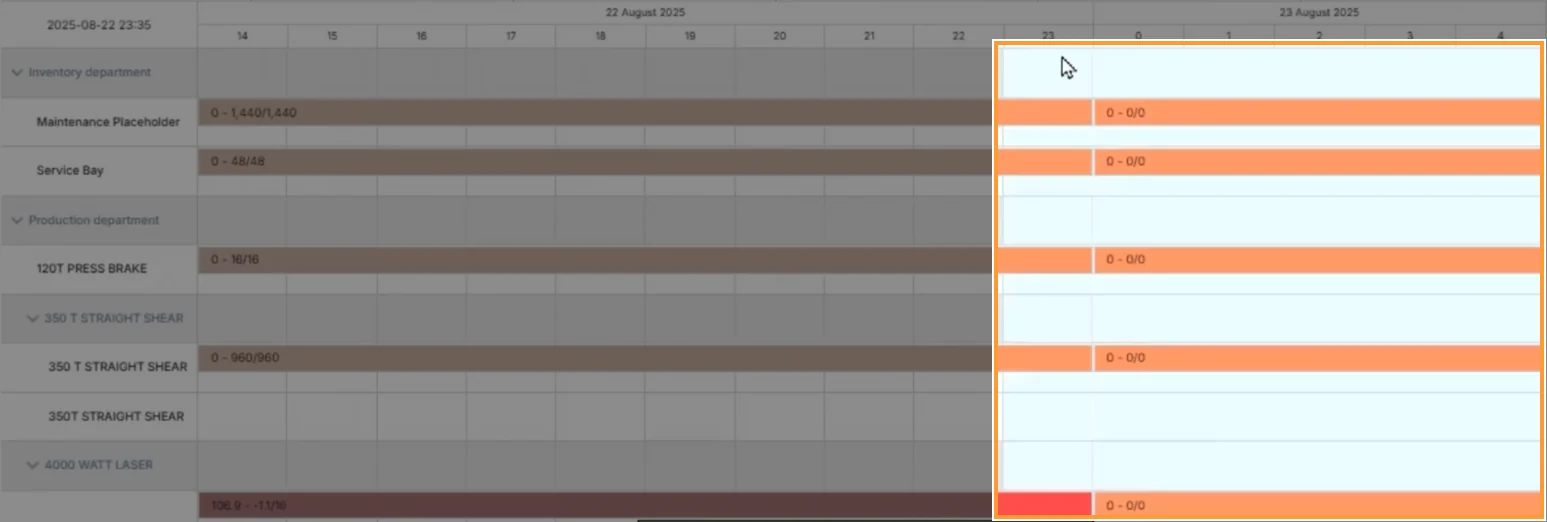
How do you show machine downtime on the schedule?
Graphical Scheduler can plot any Business Central table that has a date, a start time and an end time. That includes custom tables. Machine downtime is a good example.
One way to record downtime in standard Business Central is a capacity absence. Mark’s steps to show those absences on the board:
- Find the table behind the page. Use Business Central’s page inspection to get the table number. For absences, that is the calendar absence entry table.
- In the view, select Add data source, then Any table, and enter the table.
- Map the fields: starting time, ending time, and the work center or machine center number that places the entry on the right row.
- Set the cell template to the absence description, so each block shows its reason.
- Add a color rule, for example red for every absence.
- Choose read-only, or allow drag and drop by naming the fields to update when a block moves.
With drag and drop allowed, a planner can move a maintenance window to a quieter period directly on the board. If a source does not show up as expected, the field mapping is the first thing to check. In the walkthrough, Mark had mapped the general number field instead of the work center number.

See machine downtime on the schedule and schedule any Business Central table.
How do you move around the schedule quickly?
Date presets jump the board to a set period, such as the next two weeks or the upcoming year. Next and previous step through that period with a little overlap, so you keep your place.
Presets can be relative or fixed:
- Relative presets use date formulas. The next two weeks preset, for example, starts yesterday and runs two weeks ahead, so it always shows the current window.
- Fixed presets jump to a specific date, which helps when a planner keeps returning to one future period.
Each user can have their own presets. When you create one, you decide whether other users get it too. You also decide where it appears: on the toolbar, in the right-click menu, or only in the preset list.
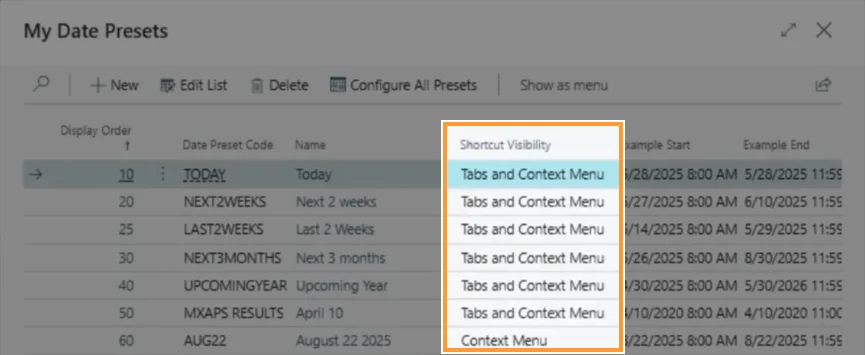
A few navigation actions save the most time:
- Zoom to document fits a whole production order on screen in one click.
- Center moves the point you right-clicked to the middle of the chart.
- Zoom from mouse zooms in around where you clicked rather than the center.
- Undo zoom returns to the previous zoom level.
- Go to date jumps to a date and time at the zoom level you choose, down to 15-minute increments.
A calendar view, similar to Outlook, is also available. It suits maintenance work more than production. See schedule date presets and production schedule zoom levels.
What happens when drag and drop stops scaling?
Dragging an operation does the same thing as changing its date on the routing line in Business Central. The other operations on that production order reschedule with it. Other production orders stay where they are, even if they now overlap on the same work center.
With a manageable number of orders, that is exactly what a planner wants. With a forecast, it gets harder. In Mark’s demo, production orders generated from a weekly or monthly forecast all land on the same work center on the same Friday afternoon. Business Central backward schedules from the due date, so that work center sits at 137.9% of capacity, more than six hours over what it can run that day.
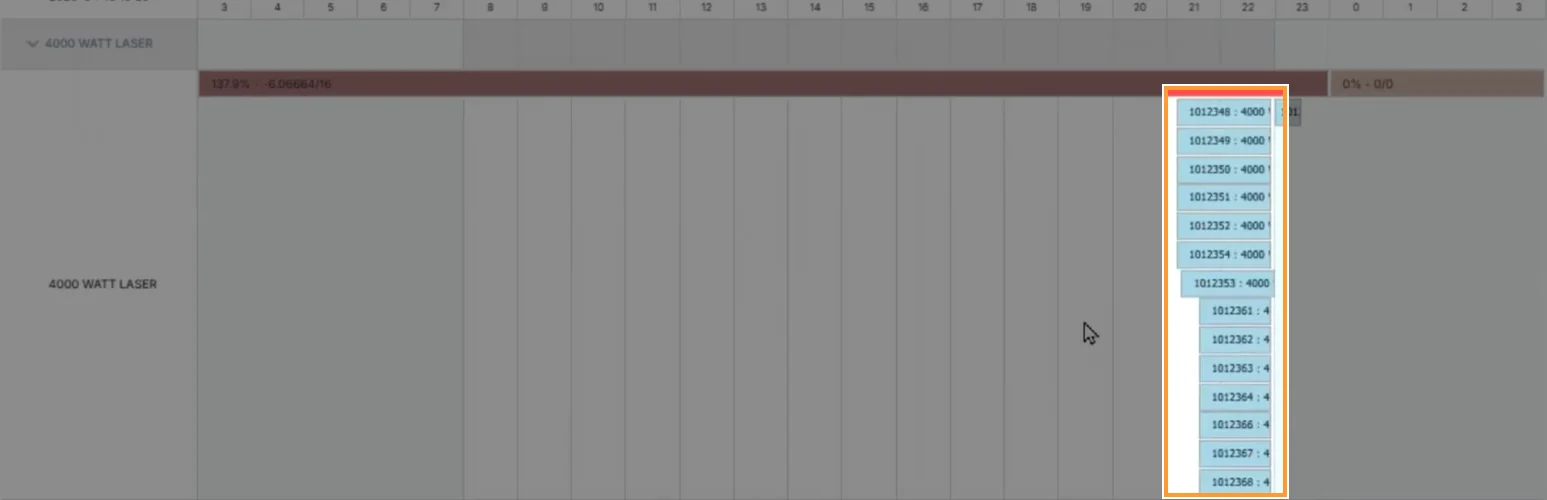
A planner can drag each order into place. With a hundred of them, that is a day of dragging. As Mark Hamblin, Senior Solution Advisor, puts it: “I don’t want to sit here dragging and dropping all day. I want the system to tell me how this should be optimally scheduled.”
That is the job of MxAPS, the Insight Works finite capacity scheduling app. In the demo, Mark schedules the next 30 days, about 60 production orders, starting at 8:00 a.m. the next day. MxAPS weighs capacity, labor and material, then shows the results:
- What-if runs. The first run shows 29 late orders. Mark adds an overtime shift and runs it again to compare.
- Alternate machines. When the preferred machine is full, MxAPS uses a slower alternate if that gives a better overall schedule.
- Labor limits. Two welding booths can run two orders at once, but after the 4:00 shift change only one welder is on. MxAPS schedules one order at a time from that point.
- Setup reduction. Similar parts are grouped so the shop sets up fewer times.
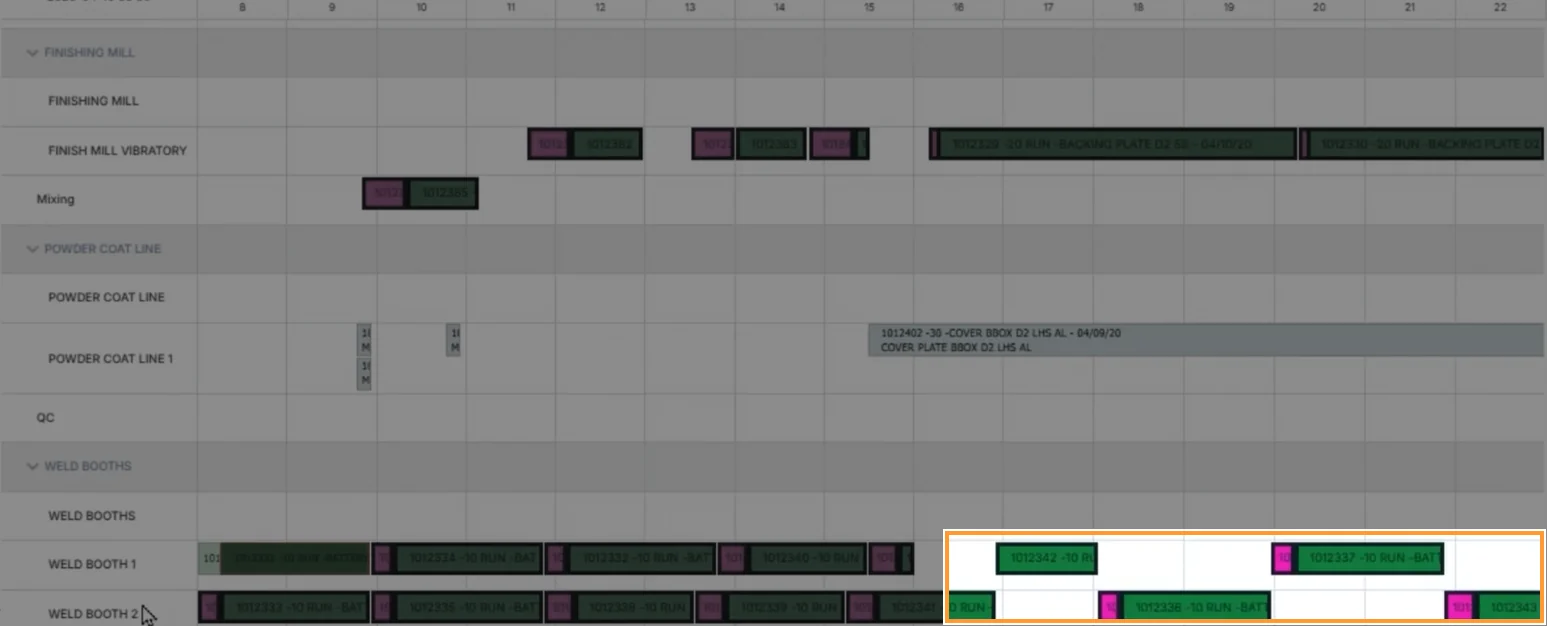
The results open in Graphical Scheduler, with setup and run time shown in different colors. A planner can still drag and drop, but the goal is a schedule the shop floor can work from as is. MxAPS can also run from the job queue.
Graphical Scheduler is free. MxAPS is a subscription licensed by the number of production orders scheduled at one time, with no limit on how many schedules you run. For a side-by-side look, read Graphical Scheduler vs MxAPS.
Frequently asked questions
Can Graphical Scheduler show data other than production orders? Yes. Any Business Central table with a date, start time and end time can be added as a data source, including custom tables. Built-in sources include work center load, working hours, holidays, warehouse picks, service orders and project planning lines.
Does dragging one operation reschedule other production orders? No. Dragging works on planned, firm planned and released orders alike, the same as changing the date on the routing line. The rest of that production order reschedules; other orders do not move.
Can each planner have their own view? Yes. Copy the default view to make a personal one, and create personal presets. Changes to the default view apply to everyone.
Can I show machine maintenance on the schedule? Yes. Add capacity absences, or any table that records downtime, as a data source. Allow drag and drop on it to move maintenance windows on the board.
Why does Business Central stack so many operations on one day? By default, Business Central backward schedules each production order from its due date without checking what else is booked on the work center. Microsoft Learn covers this under production planning in Business Central.
Is Graphical Scheduler a Business Central app or an extension? Both terms apply. Graphical Scheduler is a Business Central app, installed as an extension, and it is free for Business Central online.
When should I look at MxAPS? When you have many production orders, work from a forecast, or spend a lot of time dragging and dropping. MxAPS builds the schedule against capacity, labor and material, and Graphical Scheduler shows the result.
Get started
Install Graphical Scheduler from Microsoft Marketplace and start with the default view, then add load, working hours and downtime as you need them. To talk through MxAPS for your shop, contact your Microsoft Partner.

