
How to Visualize Work Center Capacity and Load in Graphical Scheduler
Graphical Scheduler from Insight Works can display Business Central work center capacity and load directly on the schedule. This provides production planners with a visual indication of which work centers have available capacity, which are approaching capacity, and which may be overloaded.
The visualization uses the work center calendar and production capacity requirements calculated by Business Central. Before configuring the visualization in Graphical Scheduler, make sure that Business Central has calculated capacity for the period that you want to display.
Understanding Work Center Capacity and Load
In Business Central:
- Capacity represents the amount of work that a work center can perform during a period. This is in the unit of measure configured on the work center.
- Allocated Qty. represents the capacity required by production order operations during that period.
- Availability After Orders is the remaining capacity after the allocated production requirements are considered.
- Load represents the allocated capacity as a percentage of the effective capacity.
For example, a work center with 1,440 minutes of capacity and 365 minutes allocated has approximately 25.3% load and 1,075 minutes available after orders.
Business Central calculates work center capacity from information including the assigned Shop Calendar, the work center’s Capacity, and Efficiency.
Prepare Work Center Capacity in Business Central
If you are configuring a demonstration, training, or test environment, first make sure that capacity has been calculated for the dates that you intend to show.
- Search for Work Centers in Business Central.
- Open the required work center.
- Verify the Shop Calendar Code, Unit of Measure Code, Capacity, and Efficiency.
- Calculate the Work Center Calendar for the required date range.
- If production routing operations use machine centers, also calculate the calendars for the applicable machine centers.
You can verify the results from the Work Center Card by choosing Load and setting View by to Day.
Microsoft provides additional information about calculating work center calendars here:
Set up shop calendars in Business Central
Example Capacity Setup
The following example uses CRONUS demonstration data and Work Center 100 – Assembly Department.
The example uses:
| Setting | Value |
|---|---|
| Work Center | 100 – Assembly Department |
| Unit of Measure Code | Minutes |
| Shop Calendar Code | 1 – One shift Monday-Friday |
| Capacity | 3 |
| Working Hours | 08:00-16:00 |
| Working Days | Monday-Friday |
The shop calendar provides eight working hours per day:
| Day | Starting Time | Ending Time | Work Shift Code |
|---|---|---|---|
| Monday | 08:00 | 16:00 | 1 |
| Tuesday | 08:00 | 16:00 | 1 |
| Wednesday | 08:00 | 16:00 | 1 |
| Thursday | 08:00 | 16:00 | 1 |
| Friday | 08:00 | 16:00 | 1 |
With a capacity of 3 and 100% efficiency, this produces:
8 hours × 60 minutes × 3 = 1,440 minutes of effective daily capacity.
After calculating the Work Center Calendar, a period with no production orders might appear as follows:
| Period Start | Period Name | Capacity | Allocated Qty. | Availability After Orders | Load |
|---|---|---|---|---|---|
| 2026-08-09 | Sunday | 0 | 0 | 0 | 0 |
| 2026-08-10 | Monday | 1,440 | 0 | 1,440 | 0 |
| 2026-08-11 | Tuesday | 1,440 | 0 | 1,440 | 0 |
| 2026-08-12 | Wednesday | 1,440 | 0 | 1,440 | 0 |
| 2026-08-13 | Thursday | 1,440 | 0 | 1,440 | 0 |
| 2026-08-14 | Friday | 1,440 | 0 | 1,440 | 0 |
| 2026-08-15 | Saturday | 0 | 0 | 0 | 0 |
Tip: If Graphical Scheduler shows no available capacity for a period that should contain working time, verify the Work Center Calendar in Business Central first. Graphical Scheduler relies on the capacity calculated by Business Central.
Add Production Load
Next, create or use production orders whose routing operations fall within the calculated calendar period.
For example, a production order for four units of CRONUS item 1000 – Bicycle could have the following routing:
| Production Order No. | Operation No. | Type | No. | Description | Starting Date-Time | Ending Date-Time | Setup Time | Run Time |
|---|---|---|---|---|---|---|---|---|
| 1011010 | 10 | Work Center | 100 | Wheel assembly | 2026-08-21 09:55 | 2026-08-21 12:33 | 110 | 12 |
| 1011010 | 20 | Machine Center | 120 | Chain assembly | 2026-08-21 12:33 | 2026-08-21 13:48 | 15 | 15 |
| 1011010 | 30 | Machine Center | 130 | Final assembly | 2026-08-21 13:48 | 2026-08-21 15:18 | 10 | 20 |
| 1011010 | 40 | Machine Center | 110 | Control | 2026-08-21 15:18 | 2026-08-21 16:00 | 10 | 8 |
After the production order is scheduled, return to Work Center > Load.
For this example, the load on August 21 is:
| Period Start | Period Name | Capacity | Allocated Qty. | Availability After Orders | Load |
|---|---|---|---|---|---|
| 2026-08-17 | Monday | 1,440 | 0 | 1,440 | 0 |
| 2026-08-18 | Tuesday | 1,440 | 0 | 1,440 | 0 |
| 2026-08-19 | Wednesday | 1,440 | 0 | 1,440 | 0 |
| 2026-08-20 | Thursday | 1,440 | 0 | 1,440 | 0 |
| 2026-08-21 | Friday | 1,440 | 365 | 1,075 | 25.3 |
| 2026-08-22 | Saturday | 0 | 0 | 0 | 0 |
The resulting load is approximately:
365 ÷ 1,440 × 100 = 25.3%
You can drill into Availability After Orders in Business Central to see the production capacity requirements contributing to the calculation.
For this example:
| Type | No. | Starting Date-Time | Ending Date-Time | Time Type | Allocated Time |
|---|---|---|---|---|---|
| Work Center | 100 | 09:55 | 11:45 | Setup Time | 110 |
| Work Center | 100 | 11:45 | 12:33 | Run Time | 48 |
| Machine Center | 120 | 12:33 | 12:48 | Setup Time | 15 |
| Machine Center | 120 | 12:48 | 13:48 | Run Time | 60 |
| Machine Center | 130 | 13:48 | 13:58 | Setup Time | 10 |
| Machine Center | 130 | 13:58 | 15:18 | Run Time | 80 |
| Machine Center | 110 | 15:18 | 15:28 | Setup Time | 10 |
| Machine Center | 110 | 15:28 | 16:00 | Run Time | 32 |
Microsoft provides more information about reviewing this information in Business Central here:
View load on work and machine centers
Display Work Center Load in Graphical Scheduler
Once Business Central is calculating the expected capacity and load, add the Work Center Load data source to a Graphical Scheduler view.
- Start Graphical Scheduler.
- Choose View.
- Select a view that contains production data. Alternatively, create a new view using the standard PRODUCTION data source for production order routing lines.
- Edit the view.
- From the Graphical Scheduler View card, choose Add a Data Source.
- Select All Work Center Load.
Graphical Scheduler adds the WRKLOAD data source to the view.
The standard Work Center Load data source includes the following data fields:
- Load
- Available
- Effective
- UOM
The default cell template is:
[Load] - [Available]/[Effective]
The default tooltip is:
Load= [Load]
Effective = [Effective] [UOM]
Available = [Available] [UOM]
These are the defaults created by the All Work Center Load configuration option.
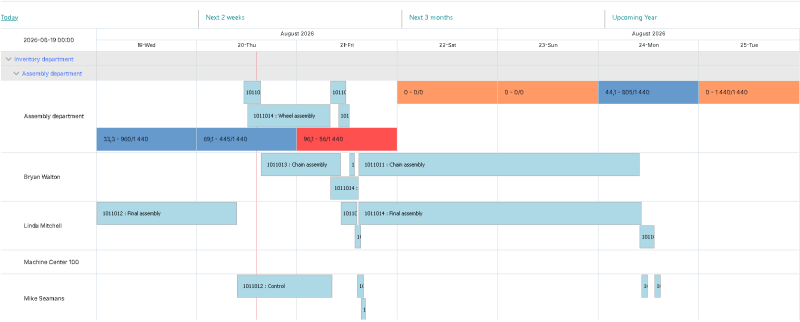
For the previous example, Graphical Scheduler displays a cell similar to:
25.3 – 1075/1440
This corresponds directly to the Business Central load information:
- Load: 25.3%
- Available: 1,075 minutes
- Effective Capacity: 1,440 minutes
How the Time Scale Affects Load
Work Center Load is calculated for the time periods displayed by the Graphical Scheduler view.
For example, if the view uses the Next 2 weeks date preset with a Day and Week time scale, work center capacity and load are displayed in daily periods.
Changing to a larger time scale can cause capacity and load to be summarized into larger periods. This is useful when planners want to review capacity at different planning horizons rather than only by individual day.
To ensure reasonable performance:
- The tool does not display all work center load when looking at very large time horizons.
- The tool will only display work center load for the Hours, Day, Week, and Month time scales.
Work Center Load Colors
When the All Work Center Load data source is added, Graphical Scheduler also creates three default styles:
| Style | Filter | Background Color |
|---|---|---|
| OVER | Load > 95 |
Light Red |
| UNDER | Load = 25..95 |
Blue Gray |
| UNSCHEDULED | Load < 25 |
Light Orange |
These styles are available from Configure Styles In This View and can be modified to match your organization’s preferred capacity thresholds and colors.
Using the earlier example, a load of 25.3% matches the UNDER style, so the work center load cell is displayed with a blue-gray background.
If additional production orders are scheduled onto the same work center and period, the load percentage increases. When the load exceeds 95%, the default OVER style changes the cell to light red.
This makes it possible to identify heavily loaded work centers visually without opening the individual Work Center Load pages in Business Central.
Using the Visualization for Production Planning
Work Center Load visualization is useful for quickly identifying:
- Work centers with significant unused capacity.
- Work centers approaching their available capacity.
- Work centers that may be overloaded.
- Days or periods where moving an operation could improve the production schedule.
- Differences between the available working calendar and the production work currently allocated to it.
The visualization does not replace Business Central’s manufacturing capacity calculations. Graphical Scheduler presents the calculated capacity and production requirements visually so that planners can more easily identify periods that require attention.
Related Information
For more information, see:
- Graphical Scheduler – Setup Guide
- Set Up Shop Calendars – Microsoft Business Central
- View Load on Work and Machine Centers – Microsoft Business Central
Still need help?
Ask other Business Central users in the Insight Works community, or send the details to the support team. Include the steps you took and any error message you saw.